Supply Chain Security is an important topic. We have seen this with huge security issues which had received a lot of media attention like Log4j commonly known as „Log4Shell“ and just recently the attack on liblzma which was given a 10.0 score on the CVE, which is the highest possible score, i.e. the most critical.
These kinds of incidents happen more frequently as software gets more complicated every day. When developing software with many people split over multiple teams, how would one manage to keep an overview of the security issues in all the used software dependencies?
In this article, we will have look at a real-world scenario and how to implement a proper workflow to handle vulnerabilities.
Case
For our scenario we have a project with:
- Chief PO: He has oversight over all POs
- Security Chief: His responsibility is to ensure security
- Five feature teams averaging with
- PO: Within his feature team, he is responsible for driving features
- Three BE developers
- Two FE developers
- One designer
- One platform team with
- PO
- Four DevSecOps/Cloud Engineers
Each feature team produces one or more production artifacts. These are microservices to be deployed.
Each role has their specific requirements:
- The Security Chief
- wants to have an overview of all vulnerabilities in production.
- Note: He does not care about vulnerabilities of software that is no longer in production, or vulnerabilities in other environments (for example on a staging system).
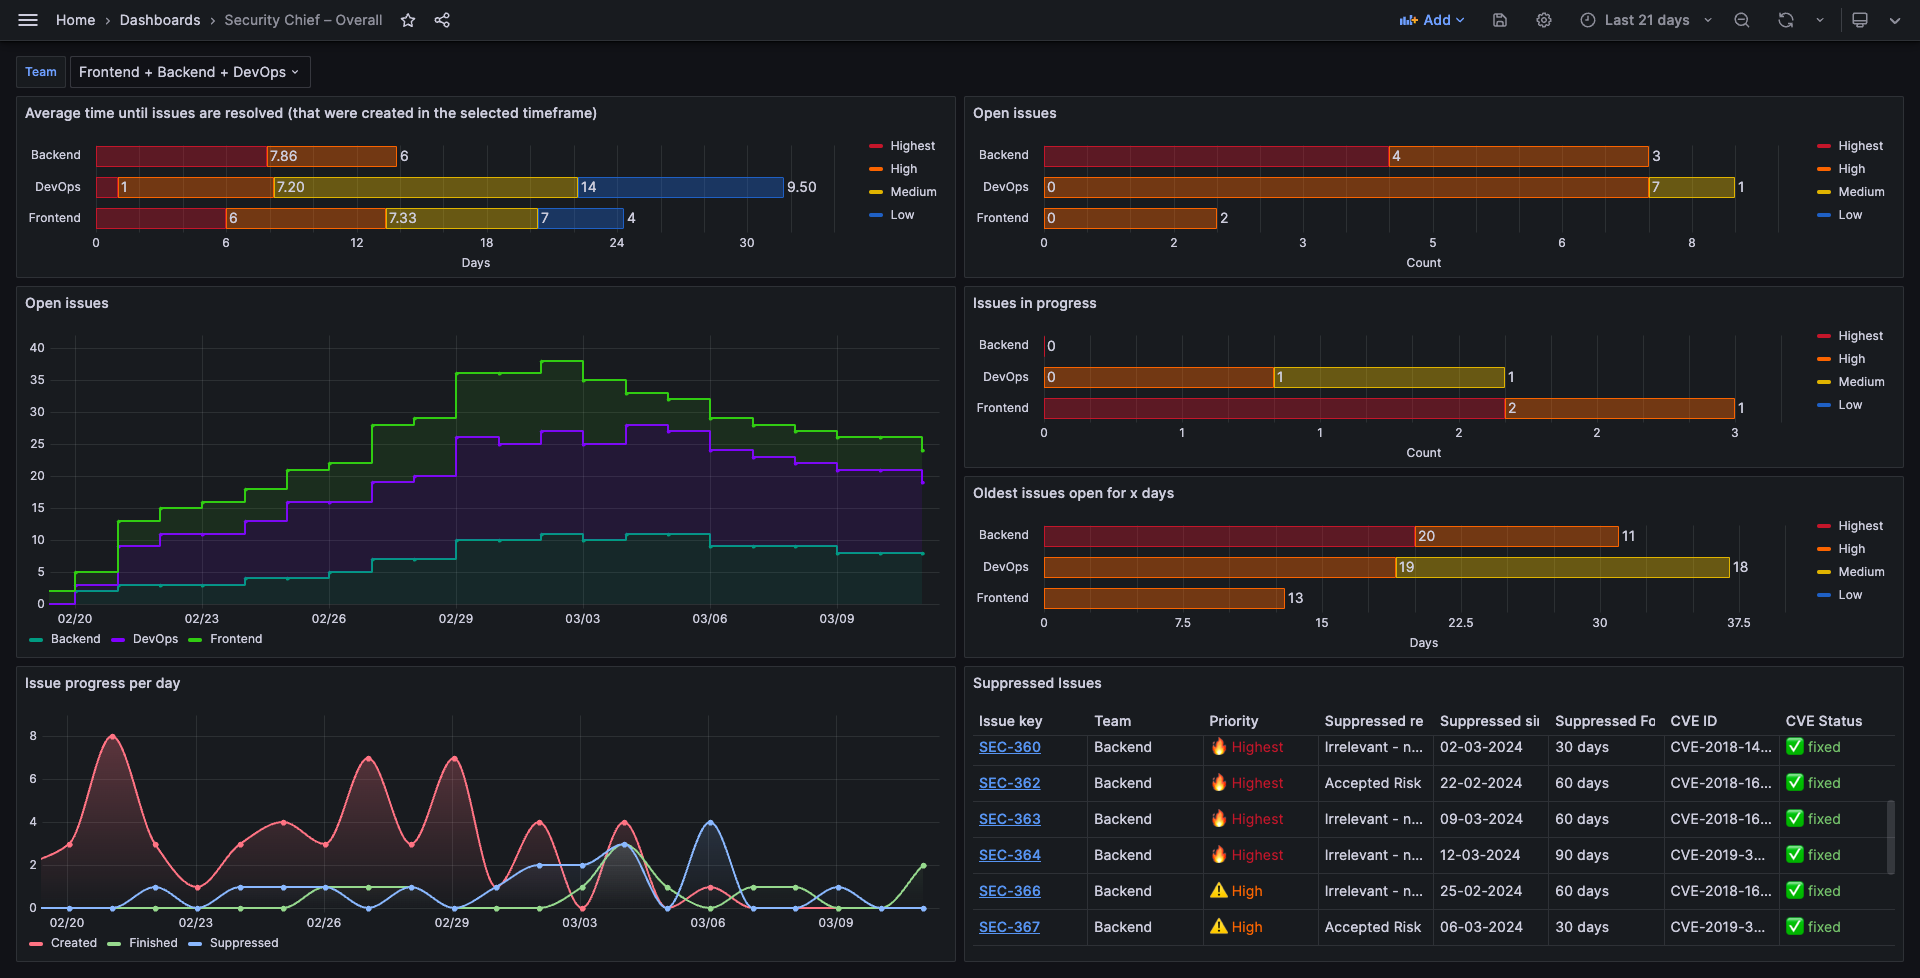
- wants to have an overview per team to see which teams do fix all their vulnerabilities, and if not, for how long fixes are already available for the vulnerabilities.
- wants to see all vulnerabilities that have been suppressed by the team and why.
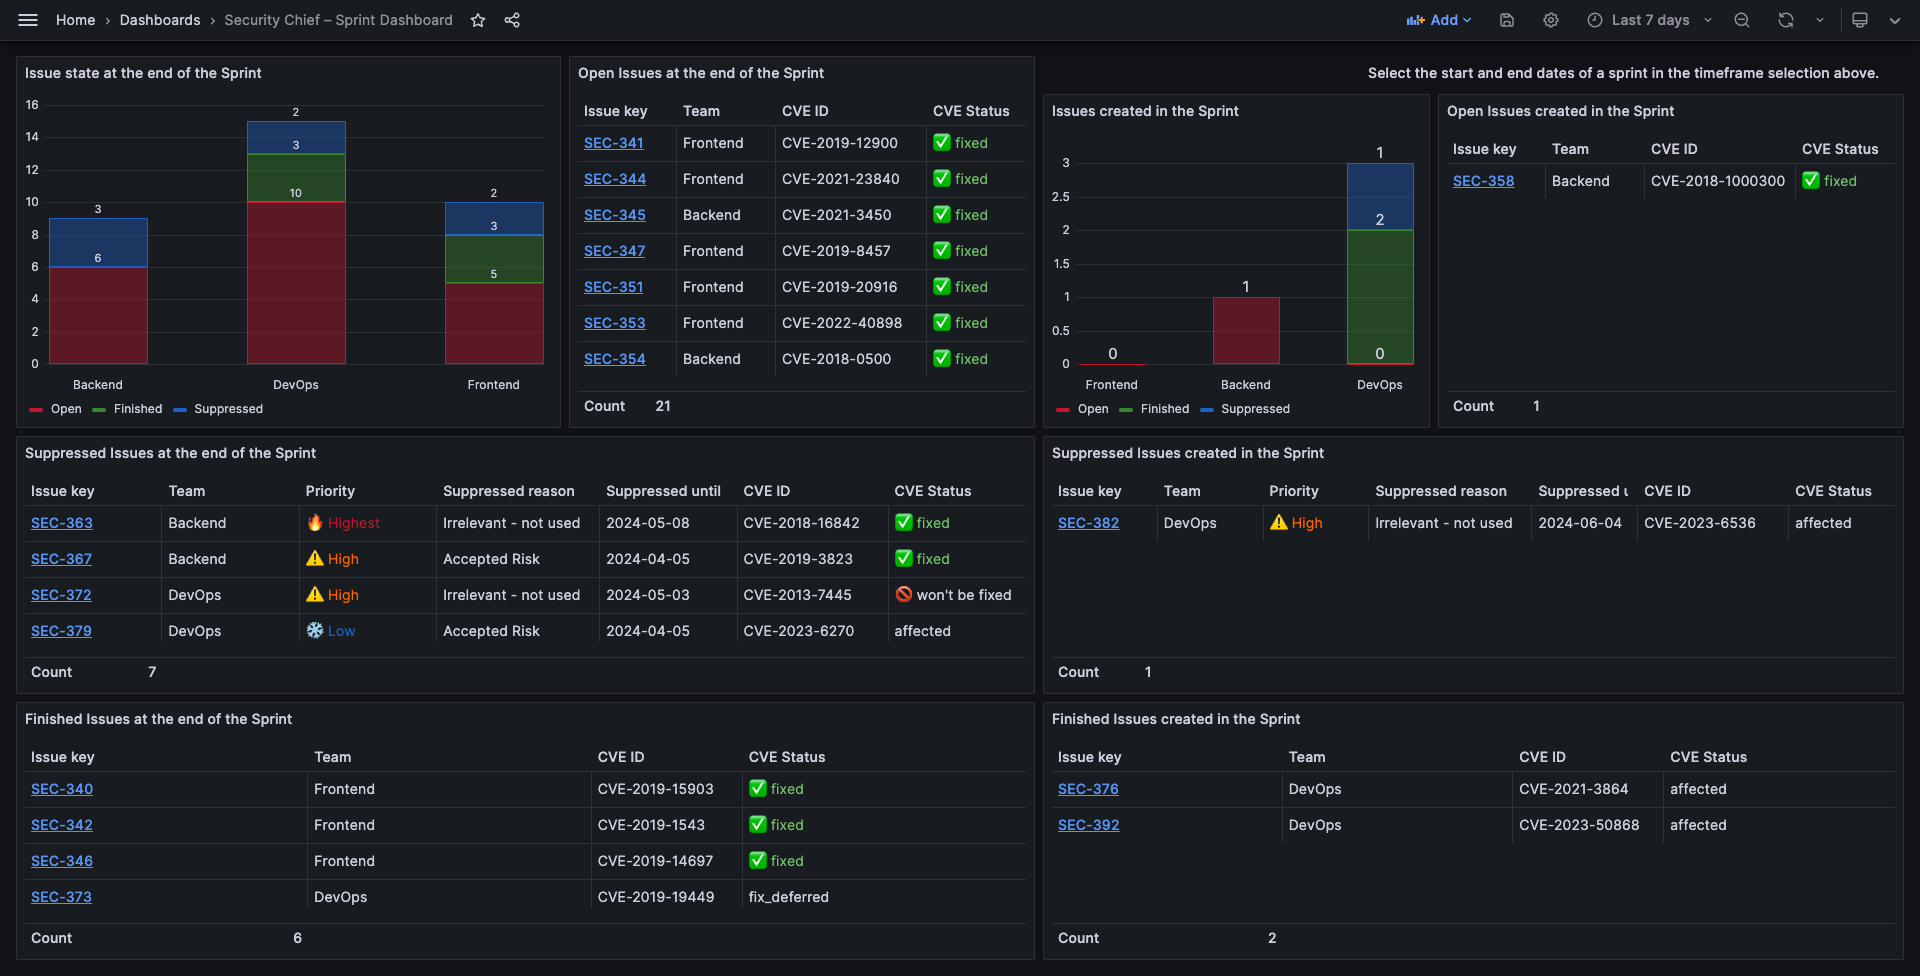
- wants to verify whether known vulnerabilities at the beginning of the sprint have been resolved at the end of the sprint and how (done or suppressed).
- wants to have an overview of all vulnerabilities in production.
- The PO
- uses an issue tracking software (for this article, we assume it’s the commonly used JIRA) for his work. He doesn’t want to invest time to create JIRA issues for vulnerabilities.
- needs to see all open security issues when he does his Sprint Planning.
- Developers
- want to see in their PRs which vulnerabilities will be fixed, newly introduced, and are still open afterward.
- need an overview of all vulnerabilities for their team. The overview should be viewable per stage.
- want to triage a vulnerability. They need a mechanism to mark a vulnerability as suppressed, set for how long the suppression is applied and for what reason they want to suppress.
Dismissing existing tools
Up front, my colleagues Markus, Daniel, Nicolas, and Fabian tested a couple of software supply chain security tools available. Big thanks for their work, as they provided screenshots and video material of the software to get a glimpse of their features. An overview of the evaluated open source tools can be found in this blog article.
After evaluating the material, and having a deeper look at the tools‘ documentation (if publicly available), we quickly came to the conclusion that neither tool would satisfy our specific, but in our opinion standard, requirements.
The common problem we see with most of existing tools, they do only look at code or images at a repository level. Either a vulnerability is there or it is not. In a real-world scenario, however, there are different stages or environments and there is development – the code evolves.
Different roles need to access different information. While a developer is interested in vulnerabilities in his current work-in-progress, the Security Chief does not care as long as it’s not on production. Some of the tools do not even offer a user management capable of distinguishing these two roles.
All of the tools we looked upon had a simple workflow for handling security vulnerabilities: Suppress or Fix. „Fix“ just means automatically creating a Pull Request. Only one tool we came across could triage an issue by letting a developer explicitly confirm a vulnerability applies.
In regards to reporting, we did not see any tool capable of producing what we need. Having issues in JIRA, JIRA’s gadgets and reports are too limited to display data in an appropriate way.
Implementing our own security checks
Due to the lack of a satisfactory standard tool, we decided to implement a solution of our own as a Proof-of-Concept.
Our setup:
- Deployments are done by updating a list „which image in which version“
- Security checks are integrated within GitHub’s CI/CD
- We use the open source tool Trivy to do the security checks
- We use JIRA to track all found security issues
- We use Grafana and a local database to provide the „at a glance“ visualizations
The PoC can be found at GitHub.
Implementation details / Reasoning behind our choices
The GitHub Action is written in pure Node.js. For a PoC, we did not need a full npm project with all its overhead to build a minimized artifact. HTTPS requests are done crudely but effectively by Node.js’s native HTTPS API. (Since Node 21 the fetch API would also have been an option. 😉)
The services definition file is an easy-to-build JSON file. This approach offers great flexibility for all setups whether you really use the very same file you have for your deployments, or use our abstraction and quickly build the file.
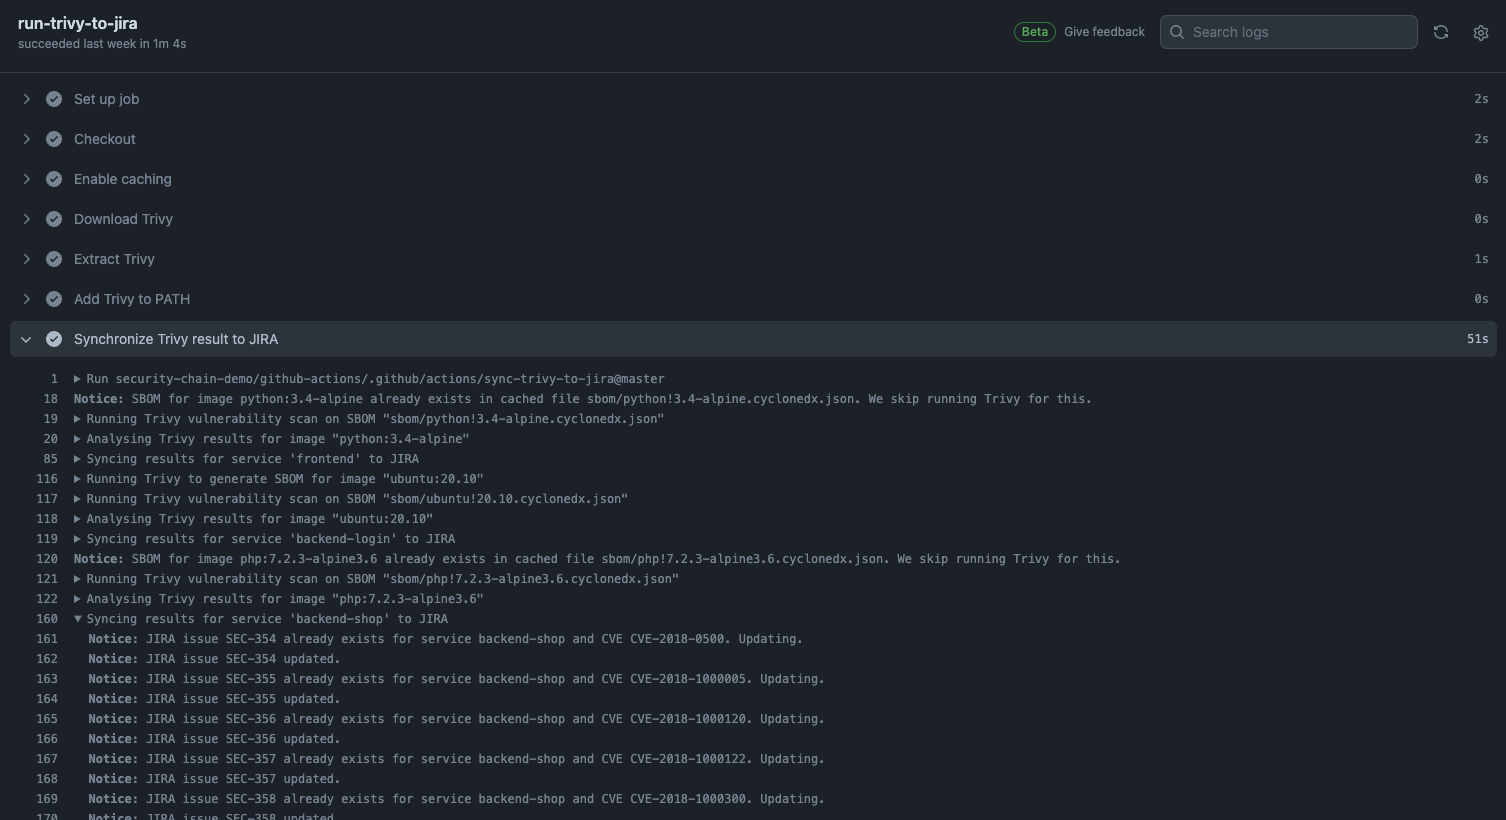
To speed up the pipeline, we split the process into generating an SBOM and scanning for the vulnerabilities. We use the caching feature of GitHub Actions to remember an already generated SBOM. In our setup, this saved 40 seconds of runtime for only four images. See the source code for further details, on what assumptions we made.

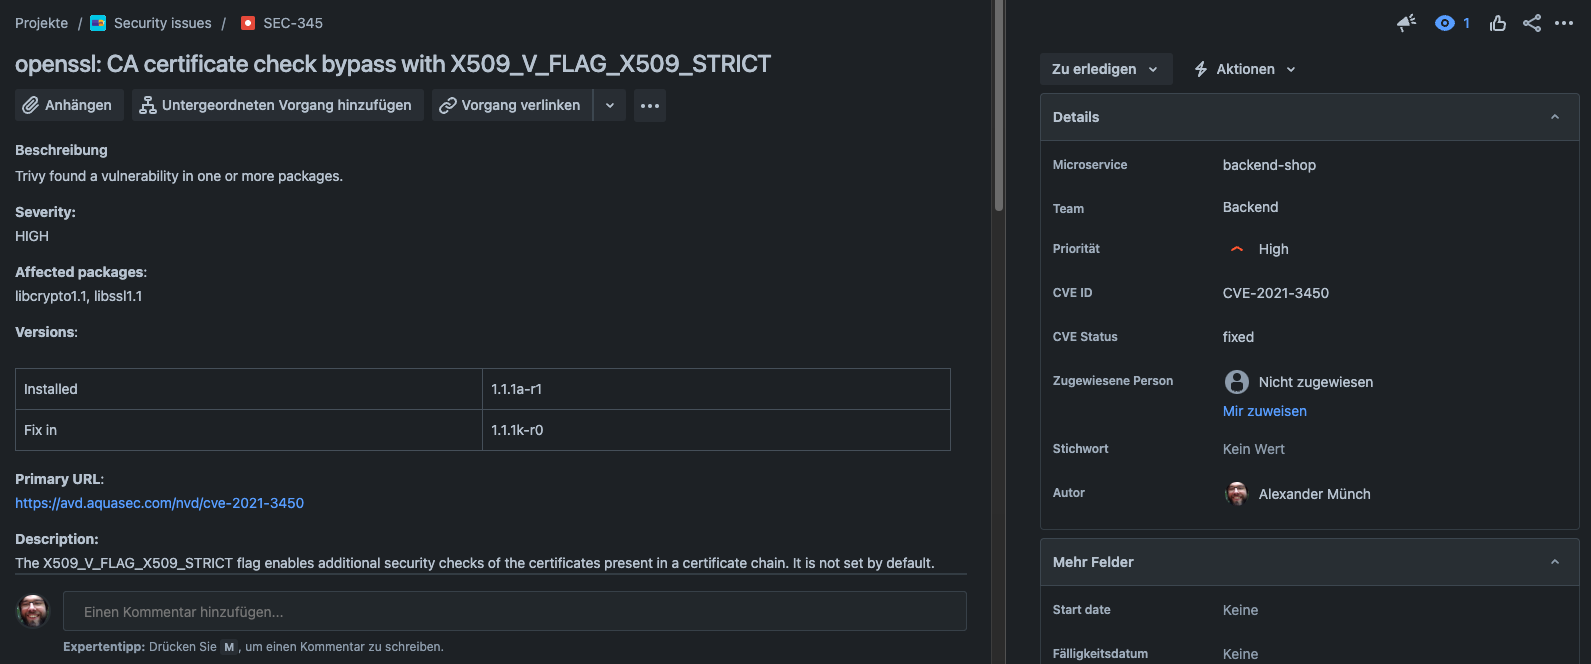
To decide if a found vulnerability already exists within JIRA we created a custom field which is filled with the CVE ID. If a CVE gets updated after issue creation we will update the JIRA issue accordingly. We deliberately do not update a JIRA issue’s priority, so the development team can triage a vulnerability specific to their application. A HIGH CVE could be discussed to be only a low-priority issue in the project.
We chose a custom issue type within JIRA to allow security issues (created automatically by GitHub Actions) and feature requests, bug reports and everything else (usual workflows for PO and the devs) to coexist in one JIRA project.
The custom issue type can then use a different status workflow. We facilitate the „Suppress“ mechanism for security issues by an additional JIRA status „Suppressed“, in contrast to the usual „Done“. Developers can not only add a single comment but also discuss a security issue within the well-known JIRA comments feature.

JIRA generally has a good API, but connecting it directly to Grafana was hard. One must do paging and resolve the fields we need. There is an Enterprise plugin, we did not evaluate due to licensing (cloud account required or Grafana Enterprise). We replaced it with only a couple of lines of Node.js code, just querying the JIRA API, getting all the issues and putting only the data we need into a MariaDB SQL database which can be easily accessed by Grafana. With SQL, we can query the data for each widget on a case-by-case basis to fit Grafana’s input requirements.
By utilizing Grafana’s variable feature, we can fit all data onto one dashboard. The Security Chief can leave the default to „All teams“ to get the overview. The Security Chief can choose to select a single team or a subset of teams to narrow the view down. The very same option can be used by a PO or dev from a particular team to show only their relevant data.

In addition we added a second dashboard focusing on the last sprint (selectable by Grafana’s timeframe option). This dashboard tells the Security Chief how many issues were open, therefore known, at the beginning of the sprint, and how many and which ones were open, suppressed or finished at the end of the sprint. This allows the Security Chief to verify the team’s PO is giving security a high enough priority in the development. The dashboard additionally features an insight into issues that were created within the sprint, therefore were not planned, and which teams could even process these on top of their planned workload.

Overall, even though this is only a Proof-of-Concept, it already contains most of the required features.
What’s missing?
Developers need a mechanism to only suppress an issue for a certain amount of time. This can easily be achieved by creating another JIRA custom field where this information can be added structurally besides the comments. A cronjob can query JIRA for all issues in the „Suppressed“ status and where this custom field is set. JIRA has the information when the issue was moved to the „Suppressed“ status. The time difference between this point in time and now only needs to be compared to the time interval specified in the custom field. If enough time has passed, the cronjob can simply transition the JIRA issue back to „Open“.
If needed, a similar custom field can be introduced to structurally acquire the „Why do we suppress?“. This information can then be used to incorporate it into reporting charts to the Security Chief.
For our PoC we only mocked this in the Grafana dashboards to show how it can look, but we did not implement the JIRA fields or the cronjob mechanism.
The second missing piece is the concept of Stages. Depending on your setup, this could introduce a large complexity we did not want to add to the PoC. Pull Requests in the deployment repository can target different stages for deployment, for example a separate test stage.
We must also think about the microservice repositories themselves. For the PoC we did not introduce them at all. In a real-world setup, each microservice has its own repository where GitHub Actions pipelines run as well. These pipelines would need to be configured with our job analysing the security issues and reporting them directly into the Pull Requests. For these PRs, you usually don’t want to sync to JIRA right away. Not every PR gets merged eventually. Only merged PRs should be synced to JIRA because only that code gets a chance of being deployed to any stage. PRs introducing new vulnerabilities could be denied merging automatically, or require a supervisor’s approval for that.
Note that, for that reason in our PoC code the services.json for example associates the frontend microservice with the image python:3.4-alpine. In reality, there would be a custom image like your-product-name-frontend:1.0. To not have this artifact public, additional steps are necessary to access a private image registry. We did not do that in our PoC, but only use arbitrary public images with a certain age, so we have vulnerabilities to find.
Outlook
To continue our Proof-of-Concept, not only the missing pieces could be implemented but there is room for any extension one might miss.
Since the whole system is under our control, specific data can easily be collected by the Node.js script, persisted into the SQL database and visualized by Grafana. You need a historical view? Let Node.js daily save important metrics for you. You need additional fields from JIRA incorporated into the Grafana Dashboard? Let Node.js fetch and persist them. You need additional dashboards for other roles? Just add them into Grafana.
Because we decided to let the vulnerability issues and the regular JIRA issues live side-by-side in the same JIRA project, we could easily mix metrics into the Grafana board, for example comparing how many security issues vs. features each team works on.
The possibilities are endless, and nothing is hindering us, since we are not vendor-looked by any chosen product.
Another point is performance. For our Proof-of-Concept, we showed speed can be improved by using caches. Our final pipeline still has a lot of room to improve, as we query JIRA for each issue, regardless of whether there actually was a change or not. Also we don’t use JIRA’s bulk API that would allow us to create multiple issues at once with only one request.
Conclusion
Overall we spend about 3 weeks, which goes from evaluating the existing tools, conceptualizing a solution of our own, implementing the GitHub pipeline with synchronization mechanism to JIRA, up to creating the Grafana reports.
To estimate the above mentioned missing points: The missing cronjob can be done in a few hours. We did not include this into our PoC because we only had the npm application running locally. The concept of Stages will take at least several weeks and depends highly on the concrete setup with its overall complexity of the deployment process.
We have shown that with only a few hundred lines of code a minimal Supply Chain Security system can be implemented. As an interface, we used commonly used and well-known software like GitHub Actions, JIRA and Grafana.
Due to the fact that we implemented all this on our own, we avoided choosing any solution that is currently on the market and therefore kept our options open to add features as we need them. For example, we are not locked in on an issue’s priority as it is reported by other tools, but have the freedom to change the priority to our needs – with the click of a button in JIRA.
In our solution, we are dependent on Trivy and its results. But Trivy is, like any other piece in our PoC, easily replaceable with a different scanner. It just needs to deliver the vulnerabilities is a common data format.
Our GitHub Action was written with the intent of being re-used across different projects and setups. The deployment repository just needs to add a Workflow using our Action. Within GitHub’s Variable settings, one can specify where the services (images and their associated teams) are defined, which minimal severity a vulnerability needs to have to be considered (e.g. ignore all MEDIUM and below), and JIRA access information and all its columns names/IDs to fit the JIRA instance to be used.
Furthermore, our solution abstracts from the repository and instead focuses on the built images, i.e. the artifacts each feature team produces. Our solution even handles the setup gracefully where one big monorepo leads to building several artifacts from. Each artifact, each associated with one feature team, gets a separate JIRA issue for each vulnerability. This reflects developers‘ workflow fixing the issue in each artifact individually.
Concluding, we would like to thank our colleague Josef for providing the problem at hand and accompanying us with input and feedback during the journey, and Daniel for reviewing our blog article up front.

