Welcome to our blog post where we embark on a journey into the world of tracing through a minimalist sample application. We’ll cover what a trace is and explore two modern collection approaches: Istio Envoy-based Tracing for microservices within an Istio service mesh and Open Telemetry-based Tracing utilizing open-source client libraries for multiple programming languages. While our focus will be on utilizing the Google Cloud as our tracing backend, the principles and techniques we’ll delve into can seamlessly apply to other backends like Jaeger and beyond. So, whether you’re new to tracing or seeking to expand your knowledge, join us as we demystify the art of tracing and its practical applications. Let’s dive in!
What Is Tracing? And Why You Want It.
When running large applications in the Cloud which are comprised of dozens of microservices, the need for effective observability is key. With well working observability in place, issues and bottlenecks can be identified early and remedied effectively which ensures reliability, efficiency and cost-effectiveness.
All observability starts with continuously gathering telemetry data from the application. The three main types of telemetry data – often referred to as pillars of observability – that are typically gathered are metrics, logs and traces. In this blog post, we will focus on tracing which enables visualizations making it possible to understand the performance characteristics of a distributed system. Metrics, traces and logs complement each other by providing valuable insights from different angles. Additionally, it should be highlighted that logs can be linked to traces providing a complete picture of the monitored system.
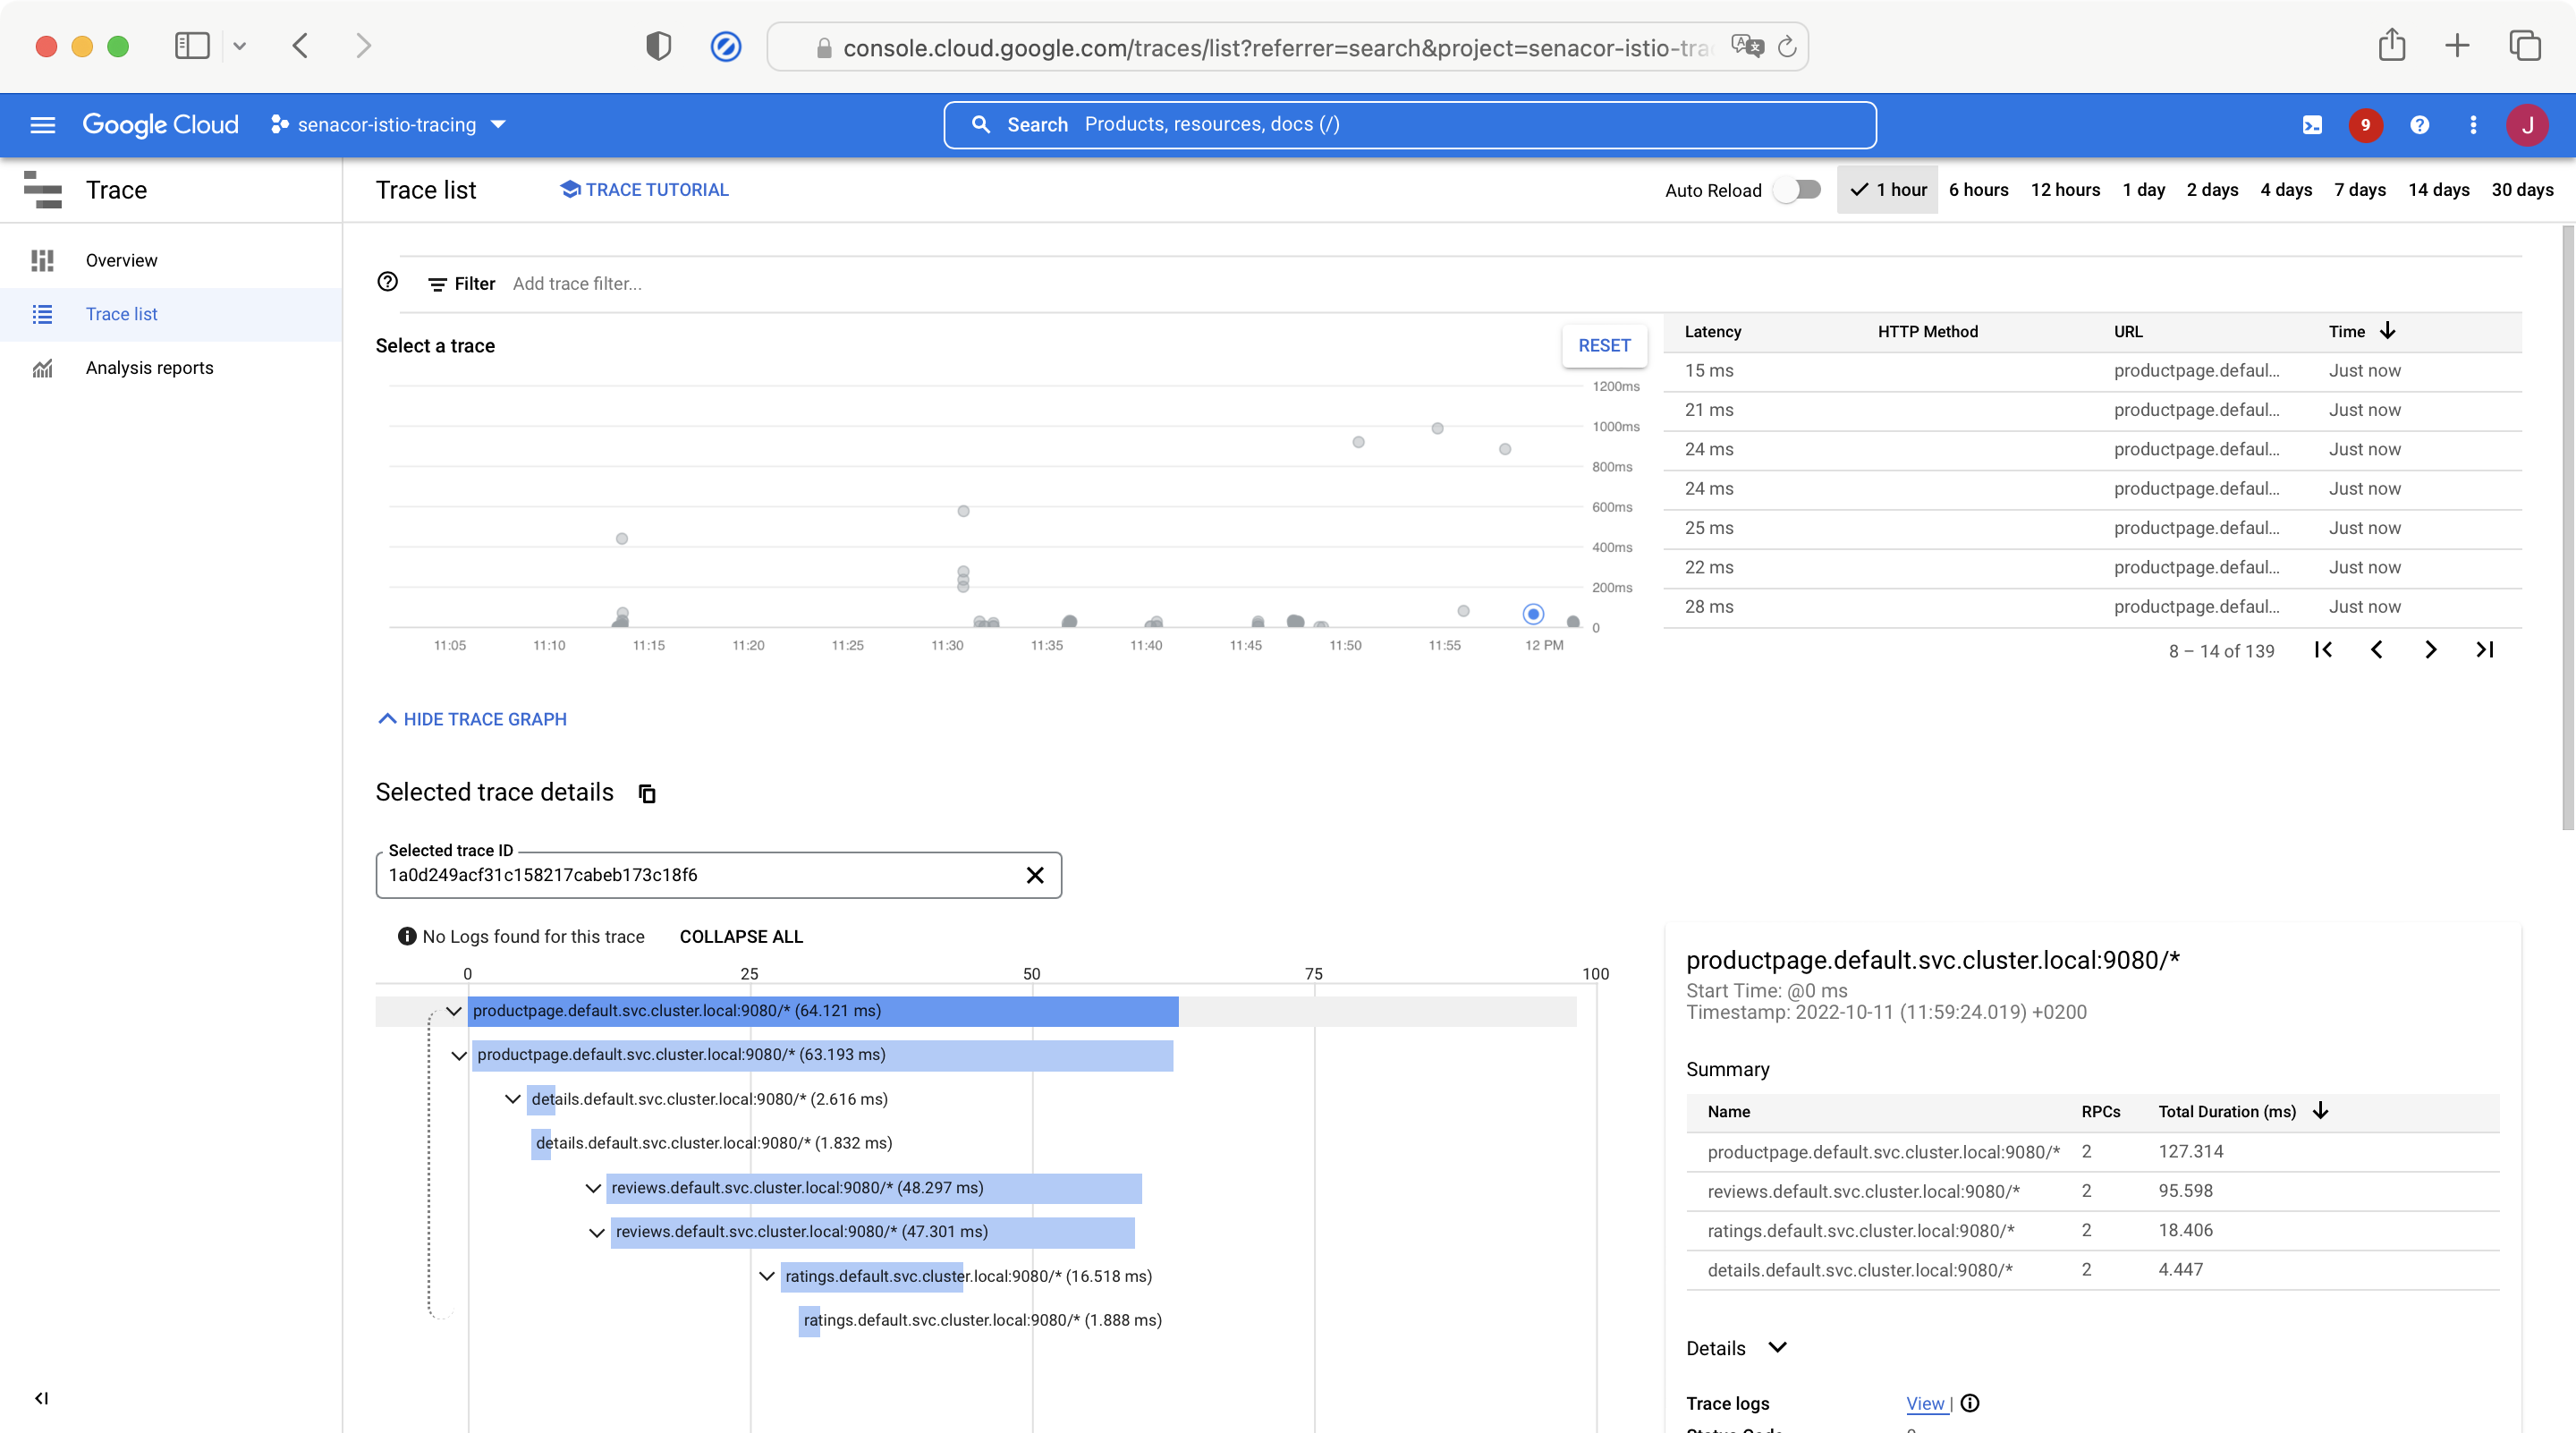
Before digging into the technical details, let’s establish common terminology first:
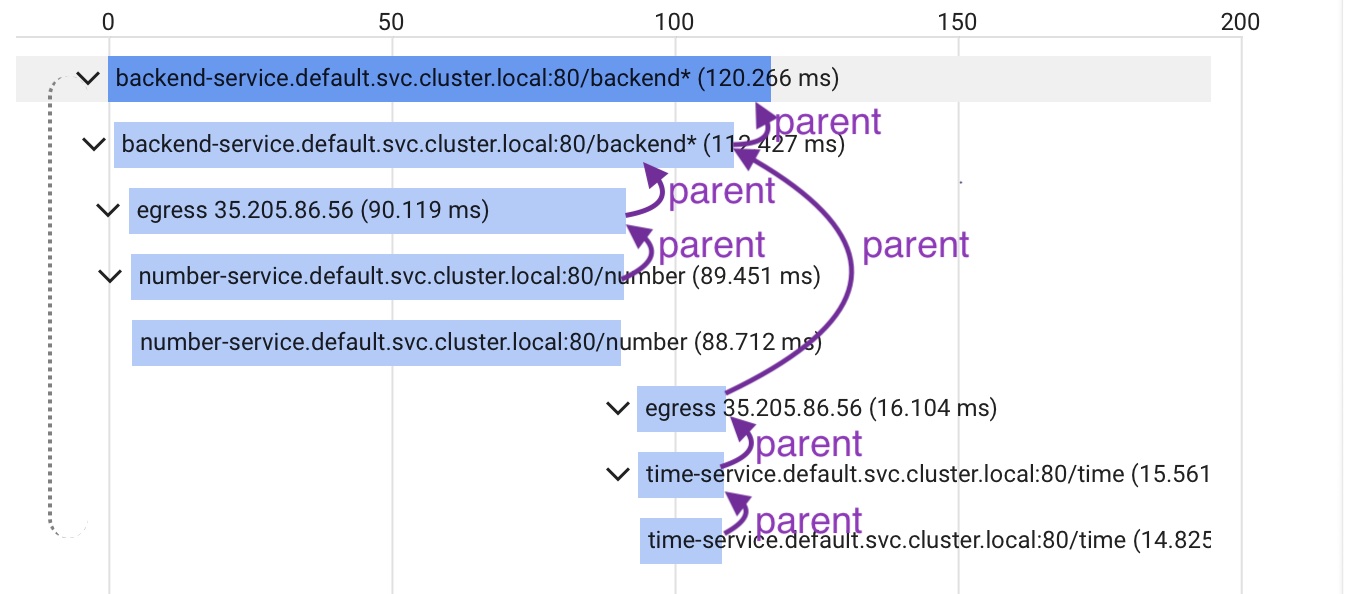
- Trace: All horizontal bars together in the picture above form what is called a trace. Each trace has a unique trace ID.
- Span: Each horizontal bar in the picture above is called a span. Spans have various data associated with them:
- Start and end time: The timing is indicated by the position and length of each bar.
- Trace ID: Specifies which trace the span belongs to. All spans in the picture are part of the same trace.
- Span ID: An ID that uniquely identifies the span within the trace.
- Parent Span ID: All spans except the root span are associated with a parent span. The parent’s span ID becomes the parent span ID of the subsidiary span. The root span is the very first span (the topmost bar in the picture) within the trace. Hence, lacking a parent span.
- Name: In the setting of web applications the name usually coincides with the request’s target URL.
- Additional metadata (Google calls it labels): Custom data which is attached to the spans.
A flame graph can answer questions like:
- Is an API gateway adding unexpected latency?
- Is a microservice deep in the call stack taking unusually long to respond? In above flame graph one could see, for example, that most of the time of the backend-service call is allocated by the number-service.
- Are operations performed sequentially or in parallel? The above diagram shows two sequential requests. First, a request to the number service is handled. Subsequently, a call to the time service takes place.
In this blog post we present two modern approaches for the collection of such tracing data:
- Istio Envoy-based Tracing: A lightweight tracing approach that can be used, when the microservices run inside an Istio service mesh.
- Open Telemetry-based Tracing: Open-source client libraries that implement the Open Telemetry standard for multiple programming languages.
Those two approaches were chosen as they show two contrary methods: The first approach does not make use of any client library for tracing whereas the second one does.
Istio Envoy-based Tracing
When running microservices on Kubernetes in an Istio service mesh, Istio can be configured in such a way that it takes care of tracing.
This is possible because every Kubernetes pod in an Istio service mesh gets an additional container attached, the Istio sidecar container which runs an Envoy proxy. Every incoming and outgoing traffic of that pod passes this proxy which does most of the trace collection logic. That’s why one can set up tracing for applications easily with Istio by doing only small adjustments in the application.
To achieve this, two ingredients are necessary:
- Istio Configuration: Istio needs to be configured with a tracing backend to which it can send the collected tracing data to.
- Service Implementation: All microservices within the mesh must propagate the trace context between incoming and outgoing requests by forwarding certain HTTP headers.
Why is the second point even necessary? Can’t Istio do tracing without modifications to the microservice code? The answer is: The HTTP headers need to be propagated so that Istio can correlate incoming and outgoing requests. Since each microservice instance can handle multiple HTTP requests in parallel, Istio needs to be told which outgoing requests were caused by which incoming requests (See Istio FAQ: Tracing).
Configuring Istio for Tracing
As a prerequisite we assume a fresh Google Kubernetes Engine cluster. Additionally, we use Google Cloud Trace, the managed offering by Google for collecting and visualizing tracing data, as the trace backend.
The installation of Istio can be performed using the istioctl command line tool. The CLI tool can be installed as follows:
curl -L https://istio.io/downloadIstio | ISTIO_VERSION=1.15.1 TARGET_ARCH=x86_64 sh -
export PATH=$PWD/istio-1.15.1/bin:$PATH istioctl install -f istio-config.yaml -y apiVersion: install.istio.io/v1alpha1
kind: IstioOperator
spec:
meshConfig:
extensionProviders:
- name: cloudtrace
stackdriver:
maxTagLength: 256 Finally, a Telemetry resource needs to be deployed via kubectl apply:
apiVersion: telemetry.istio.io/v1alpha1
kind: Telemetry
metadata:
  name: mesh-default
  namespace: istio-system
spec:
  tracing:
    - providers:
        - name: cloudtrace
      randomSamplingPercentage: 100
This configures Istio to send tracing data to Google Cloud Trace. The randomSamplingPercentage property controls how many requests to trace – in the above case all requests (100%).
Propagating the Trace Context in the Microservices
The following code (app.py) shows how the HTTP header propagation looks like for a service written in Python (backend-service) which handles each incoming HTTP request by making outgoing requests to two other services – the number service and the time service:
import requests
from flask import Flask, request
from flask_cors import CORS

app = Flask( __name__ )
CORS( app, origins="*", methods="*" )

# These headers need to be propagated, if present in the incoming request,
# to allow trace spans to be linked together.
tracing_headers = [
    "b3", "x-request-id", "x-b3-traceid", "x-b3-spanid",
    "x-b3-parentspanid", "x-b3-sampled", "x-b3-flags"
]

def extract_trace_headers( headers: dict ) -> dict:
    required_headers = {}
    # Iterate through all headers of a given request and filter those which are
    # relevant for tracing, i.e. which are contained in 'tracing_headers'
    for header in headers.keys():
        if header.lower() in tracing_headers:
            required_headers[ header ] = headers[ header ]
    return required_headers

@app.route( '/' )
def all():
    # Extract tracing headers from incoming request as they need to be
    # propagated to the number service and the time service.
    tracing_headers = extract_trace_headers( request.headers )
    number_response = requests.get( 'http://number-service/data', headers=tracing_headers )
    time_response = requests.get( 'http://time-service/data', headers=tracing_headers )
    return {
        'service': "backend-service",
        'number': number_response.json()[ 'number' ],
        'time': time_response.json()[ 'time' ]
    }

if __name__ == '__main__':
    # Set up server
    app.run( host='0.0.0.0', port=5000, debug=True, threaded=True )
The number service and the time service share the same code base but are configured by the environment variables data_type and service_name which are set in the respective Kubernetes manifest files:
import os
import time
from datetime import datetime
from random import random
from flask import Flask
from flask_cors import CORS

app = Flask( __name__ )
CORS(app, origins="*", methods="*")

@app.route( '/data' )
def data():
    # Wait for having some larger span in Cloud Trace
    time.sleep( random() / 10.0 )
    # Depending on service (time service, number service) provide the respective data
    if os.environ[ "data_type" ] == "time":
        result = str( datetime.now() )
    elif os.environ[ "data_type" ] == "number":
        result = random()
    return {
        'service': os.environ[ "service_name" ],
        os.environ[ "data_type" ]: result
    }

if __name__ == '__main__':
    # Set up server
    app.run( host='0.0.0.0', port=5000, debug=True, threaded=True )
The application can be deployed via kubectl apply demo.yaml, given the following manifest file:
apiVersion: v1
kind: ServiceAccount
metadata:
  name: backend-service
  labels:
    account: backend-service
---
apiVersion: v1
kind: Service
metadata:
  name: backend-service
  labels:
    app: backend-service
spec:
  ports:
  - name: http
    port: 80
    targetPort: 5000
  selector:
    app: backend-service
---
apiVersion: apps/v1
kind: Deployment
metadata:
  name: backend-service
  labels:
    app: backend-service
    version: v1
spec:
  selector:
    matchLabels:
      app:  backend-service
      version: v1
  replicas: 2
  minReadySeconds: 15
  strategy:
    type: RollingUpdate
    rollingUpdate:
      maxUnavailable: 1
      maxSurge: 1
  template:
    metadata:
      labels:
        app: backend-service
        version: v1
    spec:
      serviceAccountName: backend-service
      containers:
        - image: europe-west1-docker.pkg.dev/istio-tracing/istio-tracing/backend-service:latest
          imagePullPolicy: Always
          name: backend-service
          ports:
            - containerPort: 5000
          env:
            - name: service_name
              value: backend-service
---
apiVersion: v1
kind: ServiceAccount
metadata:
  name: number-service
  labels:
    account: number-service
---
apiVersion: v1
kind: Service
metadata:
  name: number-service
  labels:
    app: number-service
spec:
  ports:
  - name: http
    port: 80
    targetPort: 5000
  selector:
    app: number-service
---
apiVersion: apps/v1
kind: Deployment
metadata:
  name: number-service
  labels:
    app: number-service
    version: v1
spec:
  selector:
    matchLabels:
      app:  number-service
      version: v1
  replicas: 2
  minReadySeconds: 15
  strategy:
    type: RollingUpdate
    rollingUpdate:
      maxUnavailable: 1
      maxSurge: 1
  template:
    metadata:
      labels:
        app: number-service
        version: v1
    spec:
      serviceAccountName: number-service
      containers:
        - image: europe-west1-docker.pkg.dev/istio-tracing/istio-tracing/data-service:latest
          imagePullPolicy: Always
          name: number-service
          ports:
            - containerPort: 5000
          env:
            - name: service_name
              value: number-service
            - name: data_type
              value: number
---
apiVersion: v1
kind: ServiceAccount
metadata:
  name: time-service
  labels:
    account: time-service
---
apiVersion: v1
kind: Service
metadata:
  name: time-service
  labels:
    app: time-service
spec:
  ports:
  - name: http
    port: 80
    targetPort: 5000
  selector:
    app: time-service
---
apiVersion: apps/v1
kind: Deployment
metadata:
  name: time-service
  labels:
    app: time-service
    version: v1
spec:
  selector:
    matchLabels:
      app:  time-service
      version: v1
  replicas: 2
  minReadySeconds: 15
  strategy:
    type: RollingUpdate
    rollingUpdate:
      maxUnavailable: 1
      maxSurge: 1
  template:
    metadata:
      labels:
        app: time-service
        version: v1
    spec:
      serviceAccountName: time-service
      containers:
        - image: europe-west1-docker.pkg.dev/istio-tracing/istio-tracing/data-service:latest
          imagePullPolicy: Always
          name: time-service
          ports:
            - containerPort: 5000
          env:
            - name: service_name
              value: time-service
            - name: data_type
              value: time
---
apiVersion: networking.istio.io/v1alpha3
kind: Gateway
metadata:
  name: http-gateway
spec:
  selector:
    istio: ingressgateway
  servers:
  - port:
      number: 80
      name: http
      protocol: HTTP
    hosts:
    - "*"
---
apiVersion: networking.istio.io/v1alpha3
kind: VirtualService
metadata:
  name: routing-ingress
spec:
  hosts:
  - "*"
  gateways:
  - http-gateway
  http:
  - match:
    - uri:
        prefix: /
    route:
    - destination:
        host: backend-service
        port:
          number: 80
  - match:
    - uri:
        exact: /number
    rewrite:
      uri: /data
    route:
    - destination:
        host: number-service
        port:
          number: 80
  - match:
    - uri:
        exact: /time
    rewrite:
      uri: /data
    route:
    - destination:
        host: time-service
        port:
          number: 80
The images for the backend service and data service can be built by docker build -t backend-service:latest . and docker build -t data-service:latest . given the Dockerfile
FROM python:3.9-alpine3.16
COPY ./requirements.txt .
RUN python3 -m pip install -r ./requirements.txt
COPY . /app/
WORKDIR /app
EXPOSE 5000
ENTRYPOINT [ "python3" ]
CMD [ "app.py" ]
and the requirements.txt file
Flask==2.2.2
Flask_Cors==3.0.10
requests==2.28.1
Result for Istio Tracing
Having the demo application deployed on Kubernetes, an HTTP request can be sent to the backend endpoint. That for, a trace ID needs to be generated and passed in the X-Cloud-Trace-Context header. The <GATEWAY_URL> placeholder needs to be replaced by the IP address of the deployed gateway resource.
#!/usr/bin/env bash

# Generate Trace ID
trace_id="$(uuidgen)"
trace_id=$(echo "${trace_id//-/}" | tr '[:upper:]' '[:lower:]')
echo -e "Trace ID: ${trace_id}"

# Send request to gateway
# X-Cloud-Trace-Context header is required to add trace to Google Trace backend
response=$(curl \
  -H "X-Cloud-Trace-Context: ${trace_id}/1;o=1" \
  -s -w "HTTPSTATUS:%{http_code}" \
  "<GATEWAY_URL>/"
)
http_response_body=$(echo $response | sed -e 's/HTTPSTATUS\:.*//g')
http_response_code=$(echo $response | tr -d '\n' | sed -e 's/.*HTTPSTATUS://')

# Print response
echo -e "HTTP Response Code: '$http_response_code'"
echo "HTTP Response Body: '$http_response_body'" 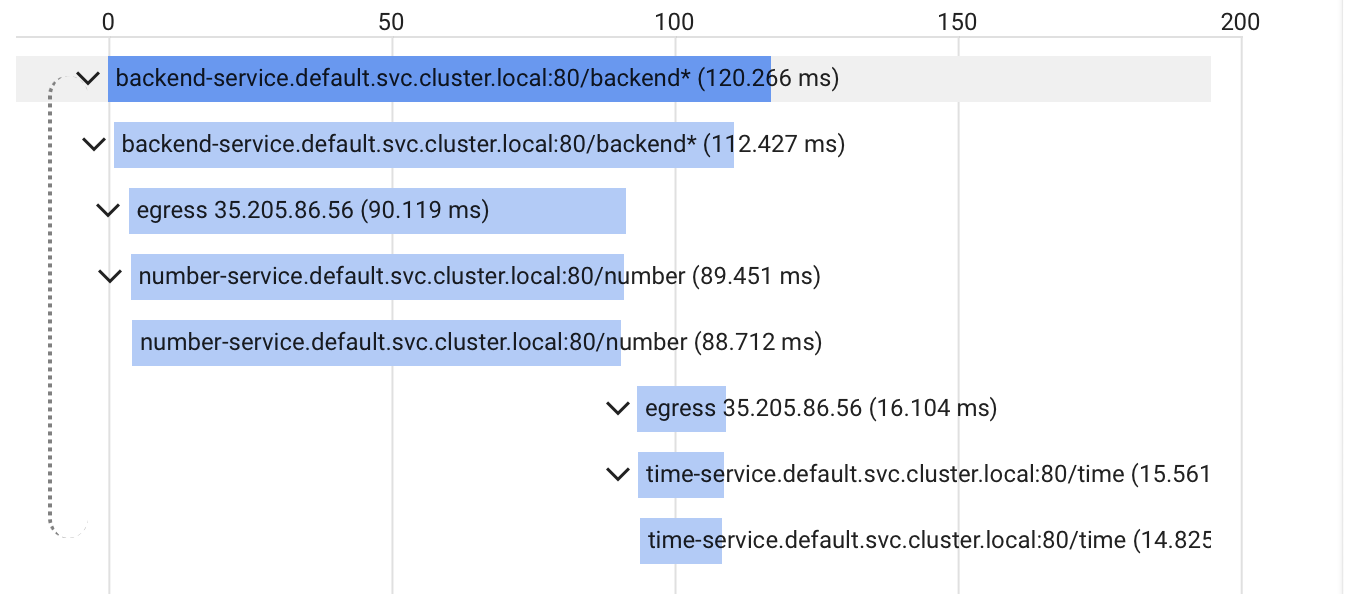
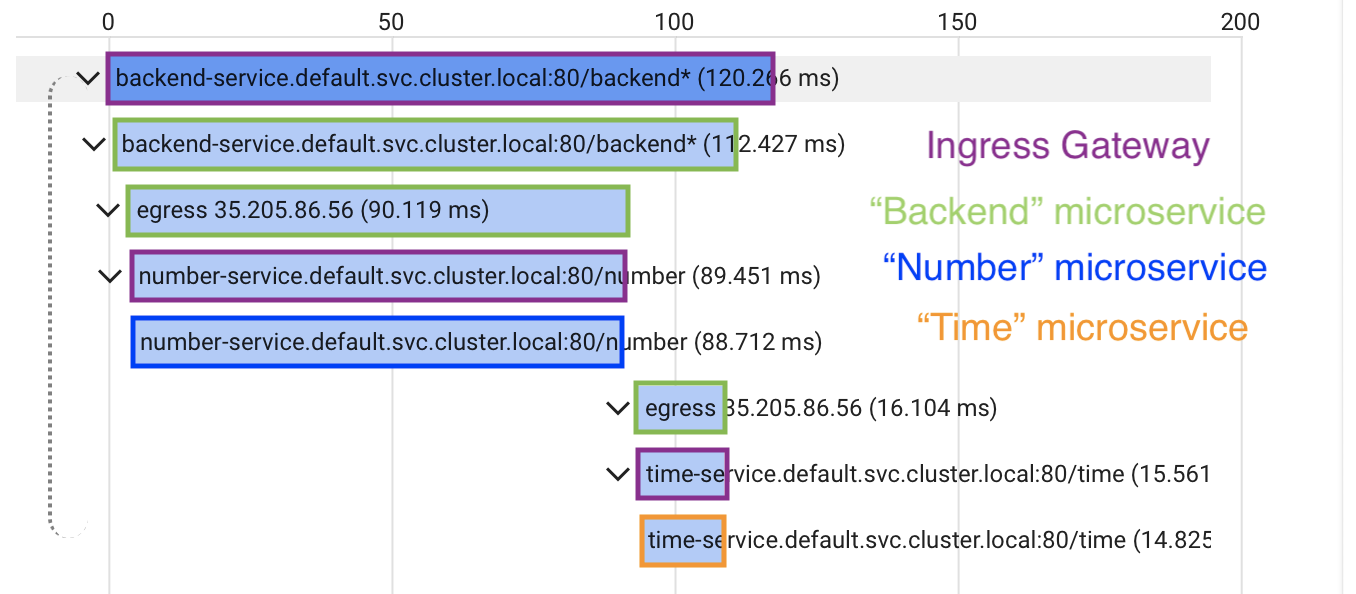
As described above Kubernetes pods consist of a main container running the application and an Istio sidecar container, the Envoy proxy. The following picture illustrates which Istio Envoy Proxy emitted each span. The spans are colored according to the value of the span tag istio.canonical_service shown in the sidebar of Google Cloud Trace (not visible here):
Open Telemetry-based Tracing
After having looked at Tracing with Istio, let’s dive into Open Telemetry-based tracing. For that, one needs to install the Open Telemetry client library of the programming language of choice – many programming languages are already supported. In the following we will use JavaScript on the NodeJS runtime.
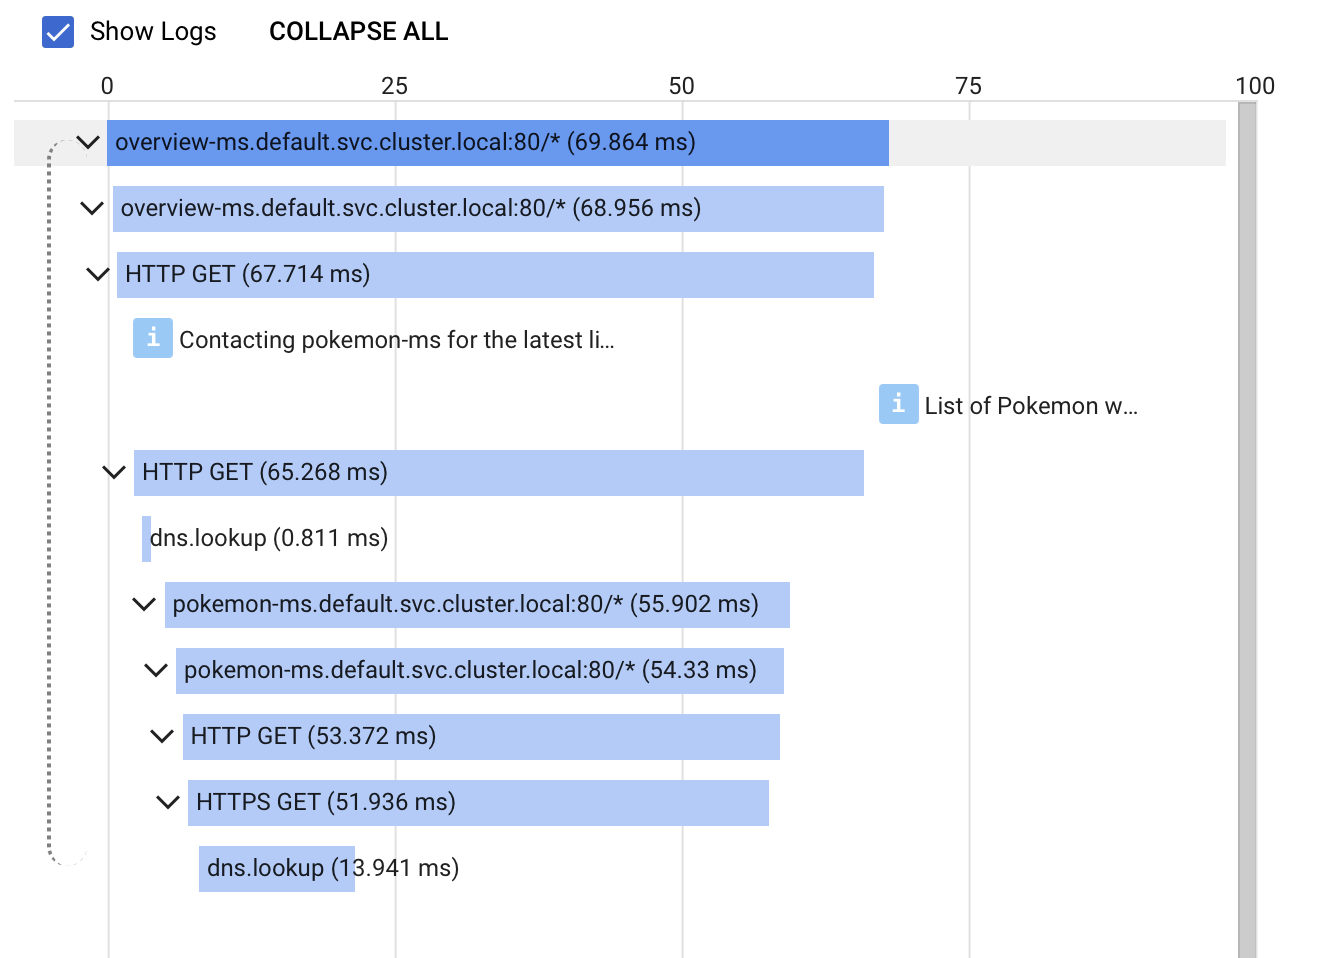
Let’s take the following setup: Two NodeJS applications (overview-ms and pokemon-ms) will be instrumented with the @opentelemetry/sdk-node client library and packed into a Docker image. The Docker image will be deployed to Google Kubernetes Engine by means of a Helm chart.
Configuring a NodeJS application for Tracing
First of all, one needs to install the Open Telemetry client library for NodeJS:
npm install --save \
  @google-cloud/opentelemetry-cloud-trace-exporter \
  @opentelemetry/api \
  @opentelemetry/auto-instrumentations-node \
  @opentelemetry/sdk-node
To get the full support of the auto instrumentation feature, the node-fetch library needs to be installed, too:
npm install --save node-fetchThis is a wrapper of the fetch command and attaches several tracing data to each HTTP request performed by fetch calls.
The libraries can then be used in the microservice:
import opentelemetry from '@opentelemetry/sdk-node'
import { getNodeAutoInstrumentations } from '@opentelemetry/auto-instrumentations-node'
import { TraceExporter } from '@google-cloud/opentelemetry-cloud-trace-exporter'
import fetch from 'node-fetch'

global.fetch = fetch // Overwrite native fetch with node-fetch for tracing support

const sdk = new opentelemetry.NodeSDK({
  traceExporter: new TraceExporter(),
  instrumentations: [getNodeAutoInstrumentations()],
})

await sdk.start()
Let’s see, what that configuration does:
- global.fetch = fetch: Use the node-fetch wrapper for calls via fetch. This auto-injects tracing data which can be collected by the Open Telemetry client library.
- getNodeAutoInstrumentations(): This is the central part of the whole tracing setup. This function tells the Open Telemetry library to collect all tracing data possible – timing of HTTP requests, log calls, etc.
- TraceExporter(): Configures Google Cloud Trace as backend where the tracing data are pushed to.
Next, one can instrument logs for tracing data:
import { trace } from '@opentelemetry/api'

const GOOGLE_PROJECT = 'senacor-istio-tracing'

const tracePrefix = `projects/${GOOGLE_PROJECT}/traces/`

export const log = (message) => {
  const spanContext = trace.getActiveSpan().spanContext()

  console.log(
    JSON.stringify({
      message,
      ['logging.googleapis.com/spanId']: spanContext.spanId,
      ['logging.googleapis.com/trace']: tracePrefix + spanContext.traceId,
    })
  )
}
Conclusion
Having considered two different approaches of instrumenting traces in the microservice ecosystem, let’s compare those methods.
Both options can be utilized with minimal effort. Without having to configure a lot, one gets a full picture of the instrumented software system. The first option requires the usage of an Istio Service Mesh, whereas the second approach can be used in every context as long as the respective client library exists. The Istio instrumentation only collects metrics about the HTTP requests not about single operations which are performed in each request. Thus, one gets a good understanding of which services are involved in each request and how long each request resides in each service. However, one cannot determine which part of a service is slowing down a request. Here the client library method is more useful. As we have seen above, the auto-instrumentation collects data for each operation performed within a request. Sometimes one does not want to instrument all operations. That is not a problem, since the client library can be configured in such a way that one can provide a list of operations for which tracing data should be collected.
All in all, we were quite surprised how easy it was to set up a basic tracing strategy. With very low effort, we received full insights into our example application. Spending some more time into fine-tuning the configuration of the client library prevented us from getting overwhelmed by a lot of uninteresting tracing data. Still, the configuration is very easy. Very useful was the linkage between traces and logs. For each trace, Google Cloud Trace provides a direct link to the corresponding log in Google Cloud Logging and vice versa.
As stated in the introduction of this article, one is not bound to the specific setup chosen in this article – using Google Cloud Platform. One could set up a similar infrastructure locally by hosting Kubernetes on a local machine. Furthermore, as the standard tracing specifications (OpenTelemetry, B3) were used, also other trace backends than Google Cloud Trace could be used. Microsoft Azure offers a solution called Application Insights and in AWS X-Ray would be an option. There are alternatives outside of the cloud ecosystem like Grafana, too.
Feel free to play with different tools and find your best fit. It’s worth to add tracing to your applications as it provides useful insights already with low effort.

